Vega-Lite Experimentation Bench
Introduction
This autumn, I have been implementing an IoT platform and visualization application using Clojure/script. When I implemented the cloud platform and described it to our customer, the customer was happy. Still, I realized that it was hard to explain the cloud infrastructure to someone with no prior knowledge of cloud technologies. Later on, I implemented a backend (using Clojure) and a frontend using Clojurescript, Reagent, re-frame, Bulma, and Vega-Lite). When I demonstrated the frontend new features every week, I could sense how excited the customer was. Finally, something concrete they could understand! Various cards and graphs visualizing the IoT device metrics! At this moment, I fundamentally realized that for many customers, the frontend is really important. And for visualizing various metrics, you have to learn to use a sound visualization library. This blog post describes my experimentation with the Vega-Lite library.
You can read more about the IoT platform implementation in my blog posts AWS IoT First Reflections and AWS IoT Storage Considerations and the frontend learning path in Clojurescript Frontend Development For Novices. You can also read my earlier blog post World Statistics Exercise in which I used Vega to visualize various health metrics in a choropleth map.
You can find all code in my personal Github repo in the vega-lite-experiment directory.
Resources
I used these resources while experimenting with Vega-Lite:
- Vega-Lite Home Page.
- react-vega. This is a React wrapper for Vega, provided by the Vega project itself.
- Observable: Vega-Lite: A Crash Course. I watched this video a couple of times and decided to add the Vega-Lite API to my Vega-Lite Experimentation Bench. I decided that for learning purposes it will be interesting to use this Vega-Lite experimentation bench to experiment with the same data sets and graphs that the lecturer Visnu Pitiyanuvath explains in that excellent video. I definitely recommend you to watch it first!
A Short Introduction to Vega
There are various levels of abstraction in providing visualizations in the browser.
- D3.js is a JavaScript library for manipulating documents based on data. D3 is intended as a supporting layer for higher-level visualization tools. D3 is a bit low level to work with, and for this reason, you should use Vega instead.
- Vega is based on D3.js but is a higher-level abstraction. Vega provides basic building blocks for a wide variety of visualization designs: data loading and transformation, scales, map projections, axis, legends, and graphical marks such as rectangles, lines, plotting symbols, etc. You create a visualization specification (json), which you pass to the Vega library to create actual graphs.
- Vega-Lite. Compared to Vega, Vega-Lite provides a more concise and convenient form to author common visualizations. Vega-Lite provides reasonable defaults and is easier to use than Vega. E.g., Vega-Lite provides a layer specification in which you can stack charts on top of each other, and Vega-Lite automatically determines how to align the axes and share scales. I have used Vega-Lite in the IoT project I described earlier.
- Vega-Lite API. Vega-Lite API is a JavaScript API for creating Vega-Lite JSON specifications. In the Observable: Vega-Lite: A Crash Course video, the lecturer uses Vega-Lite API.
Read more about Vega and D3 differences here.
Vega-Lite Experimentation Bench
For Vega-Lite experimentation, I decided that I needed my own Vega-Lite Experimentation Bench. I could have used some Clojure wrapper library like Oz or Hanami, but I wanted to use the original Javascript Vega APIs as much as possible. I.e., without using Javascript but Clojurescript, since Clojurescript provides an excellent Javascript interop. I listed some requirements for my Vega-Lite Experimentation Bench:
- Using Clojure in the backend and Clojurescript in the frontend, so that I have more chances to expose myself to Clojure development.
- Using the excellent Integrant state management library - I just love the
(reset)hotkey to update the Clojure/script full-stack app state. - Using Reagent, re-frame, and Bulma since those tools make frontend development a breeze.
- Separate the data, the Vega specification, and mechanisms to generate the graph from the data and spec.
- Provide two mechanisms to provide the graph: Vega-Lite and Vega-Lite API, for learning purposes.
The Frontend
I created three functions to provide the graph in the frontend:
vega-lite-api-render-it. This function takes a Vega-Lite API function and data as arguments, provides the Vega specification using the function argument and data, and then uses Vega-Lite API render function to render the graph to some DOM node.vega-lite-api-spec-and-vega-react-it. This function also takes a Vega-Lite API function and data as arguments, provides the Vega specification using the function and data (i.e. instead of rendering it we just call the.toSpecfunction of the Vega-Lite API object), and then uses react-vega wrapper to render the graph.vega-react-it. This function takes a raw json Vega specification and data as an arguments, provides the Vega specification using the function and data, and then uses vega-react wrapper to render the graph.
The rationale for these three functions is that I wanted to try both Vega-Lite API render and vega-react wrapper.
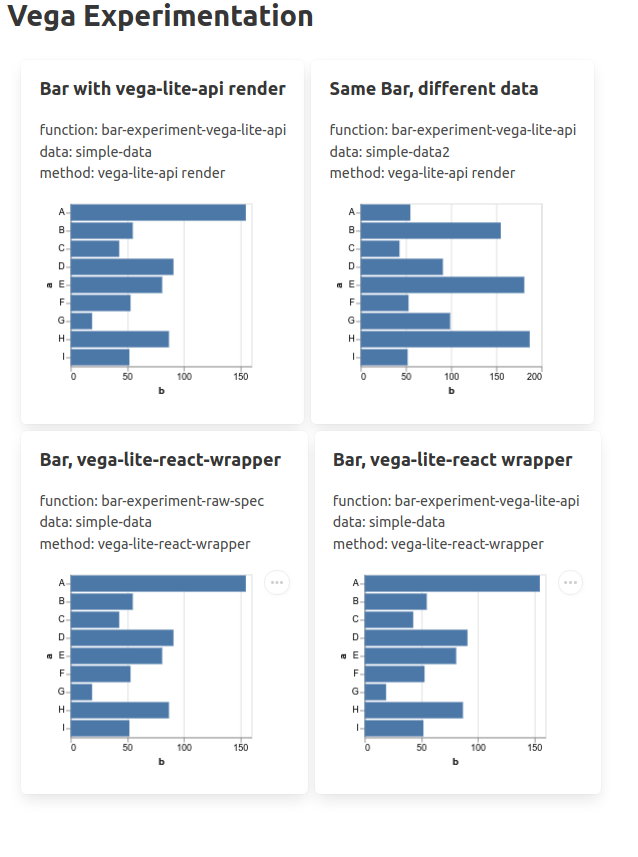
I use Bulma boxes to provide meta-information regarding each graph (title of the graph, function that I used, the data set, and one of the three methods I described above) and the actual graph itself.
In the main.cljs file I have a function home-page which has a section for each graph I wanted to demonstrate:
(defn home-page []
  (v-util/clog "home-page")
  [:div.container {:id "home-page-container"}
   [:div.columns.is-multiline.is-mobile.m-2.p-2 {:id "home-page-columns"}
    [vega-lite-api-render-it bar-experiment-vega-lite-api simple-data
     {:title "Bar with vega-lite-api render"
      :func-name "bar-experiment-vega-lite-api"
      :data-name "simple-data"}]
    [vega-lite-api-render-it bar-experiment-vega-lite-api simple-data2
     {:title "Same Bar, different data"
      :func-name "bar-experiment-vega-lite-api"
      :data-name "simple-data2"}]
    [vega-react-it bar-experiment-raw-spec simple-data
     {:title "Bar, vega-lite-react-wrapper"
      :func-name "bar-experiment-raw-spec"
      :data-name "simple-data"}]
    [vega-lite-api-spec-and-vega-react-it bar-experiment-vega-lite-api simple-data
     {:title "Bar, vega-lite-react wrapper"
      :func-name "bar-experiment-vega-lite-api"
      :data-name "simple-data"}]]])
...
(Note: the content of the home-page function might, later on, be different - I continue to use this Vega experimentation bench in my future Vega studies.)
Here you can see the four demo bar graphs produced by the functions mentioned above:
So, now my Vega-Lite Experimentation Bench is ready. I can now easily write various Vega specifications in my experimentation bench and use the Integrant (reset) hotkey to update the html page to check the results.
In my next blog post, I’ll continue this Vega-Lite Experimentation story explaining how I use the backend to provide more complex data and how I use the Vega-Lite Experimentation Bench to study and learn to use Vega specifications.
The writer is working at Metosin using Clojure in cloud projects. If you are interested to start a cloud or Clojure project in Finland or you are interested getting cloud or Clojure training in Finland you can contact me by sending an email to my Metosin email address or contact me via LinkedIn.
Kari Marttila
Kari Marttila’s Home Page in LinkedIn: https://www.linkedin.com/in/karimarttila/