How to do Application Logging in AWS?
Introduction
Let’s continue our Amazon Web Services competence building and talk about our experiences regarding how to do application logging in AWS infrastructure.
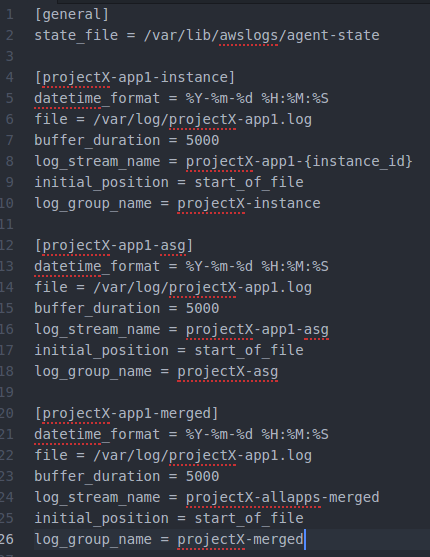
Example of an AWS Logs configuration sending Log streams to three different Log groups.
Introduction
AWS Logs is provided by AWS CloudWatch. AWS Logs provides two primary concepts to categorize your logs: Log Groups and Log Streams. You can have 5000 Log Groups / AWS account / region, and multiple Log Streams inside Log Groups.
Let’s then discuss the various tasks related setting up your application logs to be used with AWS Logs. I’m concentrating here mostly on how to do logging in application logic modules deployed using EC2 images. Let’s write another blog post later on how to do logging regarding other AWS resources.
1. Configure Rolling File Logger for your Application
The first task is to implement a basic rolling file logger for your application. This is a trivial task and you can use your favorite logger. We use in Java environment Spring Boot’s basic logger, Logback. You need rolling file logger not to fill up your EC2’s instances local disk. Another option would be to log to stdout and glue AWS logging to stdout (using stdout is actually one of the best practices in cloud logging).
2. Configure AWS Logging to your Golden Image
As you have read in our previous AWS blog articles we are using golden images (all infrastructure, application and configurations are baked into the Amazon Machine Image — no configurations are done after the baking is done — if we need to make changes to the AMI we just create a new AMI).
We are using Packer / Ansible to bake AMIs. So, you just add instruction to Ansible configuration to install awslogs package to the Linux AMI. And another configuration to start the AWS Logs as a service in the EC2 boot.
3. Decide Strategy for AWS Log Streams and Configure it
You can send your application logs to more than one AWS Log stream. We have utilized the AWS Log Groups / Log Streams hierarchy in the following way (which is also depicted in the screenshot in the beginning of this article).
We have have an environment acronym (“dev-“, “test-“, “perf-“, “qa-“, “prod-“…) in all Log Groups. This way it is easy to filter those Log Groups in AWS CloudWatch that you are interested of (actually we add the environment acronym to every AWS resource we create in Terraform — this way it is easy to filter the environment related resources in every AWS Console view).
Then we have three Log Groups in every environment:
- One Log Group for each instance: this log group comprises of Log Stream per every individual application instance. This is the “projectX-app1-instance” section in the screenshot.
- One Log Group to merge logs from applications belonging to the same AWS Autoscaling Group — you might be interested to look logs of certain application regardless of the EC2 instance the application is running on. This is the “projectX-app1-asg” section in the screenshot.
- One Log Group which merges every single application instance of every autoscaling group to one big Log Stream — this Log Stream can be configured to be watched for warnings and errors that happen anywhere in the system. This is the “projectX-app1-merged” section in the screenshot.
It is pretty easy to configure your application to send its logs to AWS Logs: just configure an “awslogs.conf” file that is baked into the golden images using Packer / Ansible. The only exception is how to bake the environment acronym to the AWS Logs configuration. Since we use golden images that are used the same way in each environment you cannot bake the environment acronym to the golden image. Inside the EC2 instance you can query the environment many ways. We do it like this: In the initial boot the EC2 instance queries its metadata (“Hi, I’m alive! In which environment am I running in?”), finds its environment, and makes the final tweaking to the AWS Logs configuration file.
You don’t need to create the Log Group and Log Stream AWS resources — those will be created automatically by the AWS Logs infrastructure once the AWS Logs configuration is done and EC2 / application boots and starts sending its logs to the AWS Logs.
4. Monitor AWS Logs
Now you have a very fine grained view to your applications’ logs. You can setup various monitoring filters to those Log Groups and Log Streams. We have added in Terraform scripts AWS CloudWatch Alarms to monitor certain AWS Log Events (and tons of other AWS Monitoring Events: EC2, SQS, RDS, Kinesis, Firehoses, Redshift… but let’s write another article about these).
AWS is API driven which means that you can control every aspect of AWS using its Command Line Interface. We have implemented a simple custom log filter application using Python and AWS CLI. Log filter application monitors the common Log stream (remember — the one that merges every autoscaling group’s every instance’s logs into one big stream). When it sees a log event we are interested about it sends an event to that environment’s AWS SNS’s (Simple Notification Service) various topics. Our developers have subscribed those topics that they are interested of — e.g. production warnings and alarms, development environment’s certain applications information topic for debugging etc.
Conclusion
This was a brief introduction how to utilize AWS Logs and glue it together with other AWS services like AWS Simple Notification Service, AWS CloudWatch and its Alarms etc. Our recommendation is this: If you do application logic using EC2 / Docker, define and implement a good logging infrastructure to get good insight what is happening inside your system.
The writer is AWS Certified Solutions Architect Associate and AWS Certified Developer Associate, architecting and implementing AWS projects in Tieto CEM Finland. If you are interested about starting a new AWS project in Finland, you can contact me with firstname.lastname at tieto.com.
Kari Marttila
Kari Marttila’s Home Page in LinkedIn: https://www.linkedin.com/in/karimarttila/